Gold trading performance becomes easier to understand when the numbers are shown together: how many trades moved in the right direction, how gains compared with losses, and how position size changed the outcome. This cumulative IQQTrading review brings 213 supplied closed XAUUSD positions into one view, with observed closing dates from 1 September to 19 October 2026. [S001]
The comparison uses the same recorded entries and exits at three fixed sizes: 0.1, 0.5 and 1.0 lot per trade. USD figures use an explicit model of 100 troy ounces per lot. These are historical price-based illustrations with no separate cost deductions, not a statement of actual account net profit. Snapshot prepared on 20 October 2026.
In this review
Gold trading performance at a glance
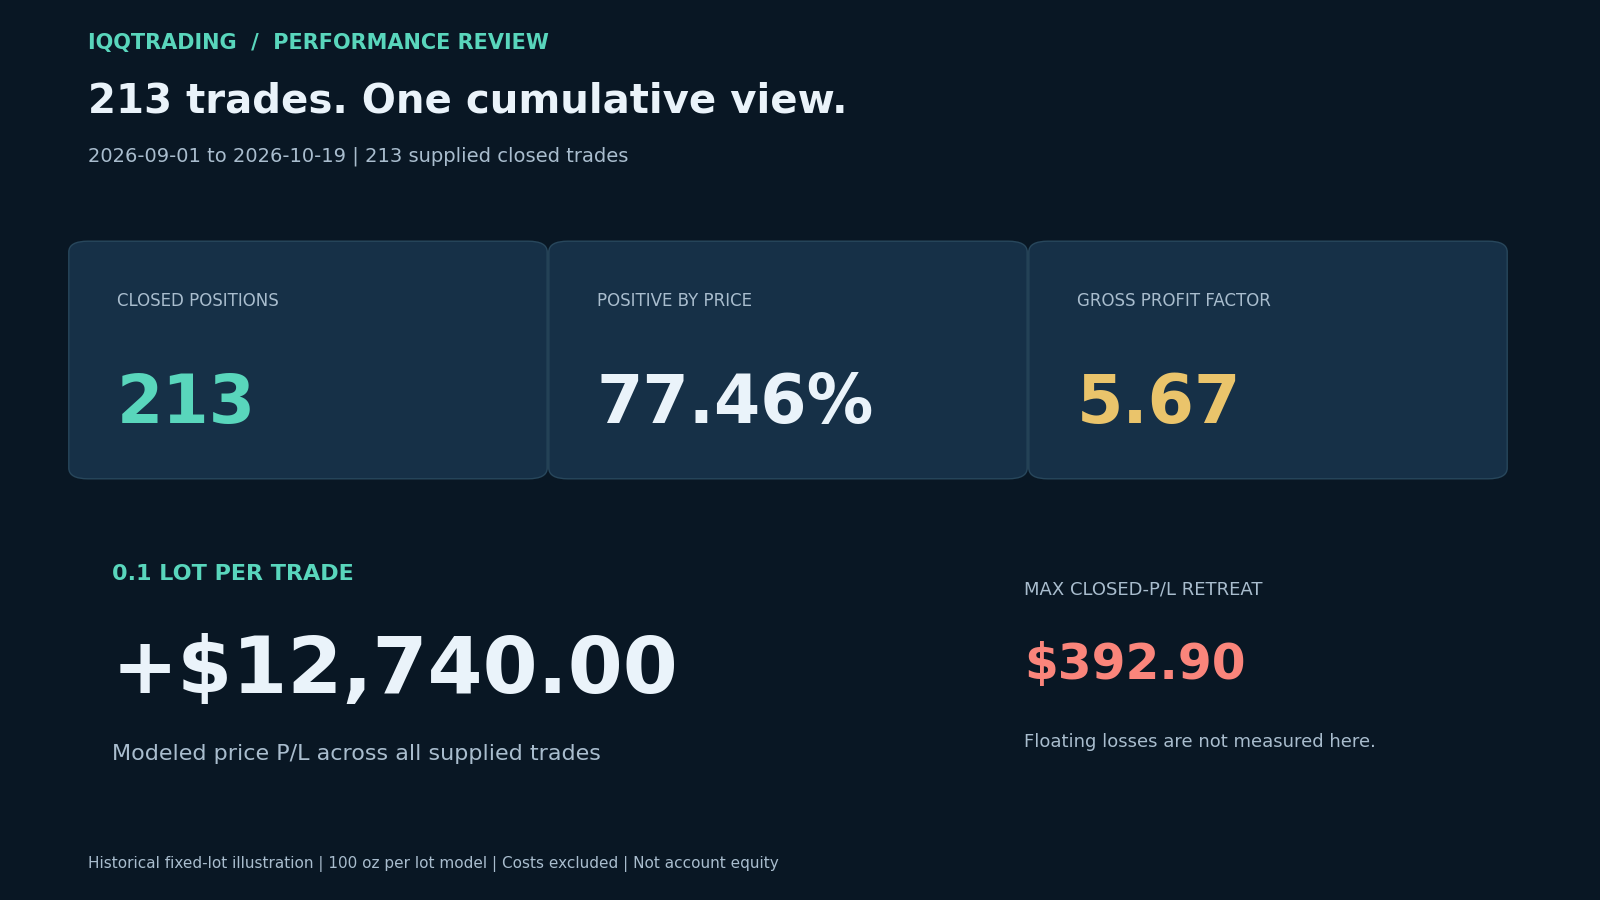
The supplied history contains 165 positions with a favorable entry-to-exit price move and 48 with an unfavorable move. That gives a price-based positive-trade rate of 77.46%. No position finished at exactly the same opening and closing price. Balance transactions are excluded from trading results. [S001]
At a constant 0.1 lot per position, the model produces USD 15,466.00 from positive trades and USD 2,726.00 in negative trades, leaving USD 12,740.00 of cumulative price P/L. The gross profit factor is 5.67: approximately USD 5.67 of positive price results for each USD 1.00 of negative price results in this particular sample. [S001]
These figures describe the supplied closed trades. They do not establish that every account position or trading day is present, and the broker time zone was not supplied. The date range is therefore the observed range of closures, rather than an independently verified statement period.
The trade mix behind the result

A positive-trade percentage answers one question: how often did the recorded exit improve on the entry in the trade's direction? It does not describe the size of every gain or loss. The profit factor adds that second dimension by comparing the sum of positive outcomes with the absolute sum of negative outcomes under the same calculation method.
For this review, every position receives the same modeled lot size. Original position volumes and the source exports' money columns are not used to calculate the fixed-lot comparison. This makes the three scenarios directly comparable: the trade list and price movements stay the same while the volume changes. The source records remain private and have not been independently audited. [S001]
What a 5.67 profit factor does and does not tell us
The 5.67 figure belongs to this historical, price-only model. It is not a future profit forecast. It also cannot describe floating losses while positions were open. A sequence can finish strongly and still require significant capital or carry uncomfortable temporary exposure before positions close.
The useful reading is specific: positive recorded price movements outweighed negative ones in the supplied sample at a constant trade size. Whether a live account can reproduce that result depends on its actual fills, contract specifications, costs, available capital and trading constraints.
Following the cumulative result over time
The upper chart adds results when positions close, using the 0.1-lot scenario. It is a step chart: a change marks a recorded closure, while a flat section means no additional closed result was added. The line begins at zero cumulative P/L, not at a claimed starting account balance. [S001]
This is a cumulative view of all supplied trades through the stated cutoff. The latest closure in the current snapshot is dated 19 October 2026. It is not presented as last week's result, and it does not reset at the start of a new calendar week. Future dated reviews can show both newly closed positions and the updated running total.
Reading the drawdown panel correctly
The lower panel measures the retreat from the highest previous value of that closed-trade P/L sequence. At 0.1 lot per trade, the largest observed closed-P/L retreat is USD 392.90. Closures sharing the same recorded timestamp are grouped together, rather than inventing a ticket-by-ticket order inside that second. [S001]
Chronology follows the supplied timestamps; alignment of time zones across the supplied files has not been verified. This measurement is not intratrade equity drawdown. Open-position valuations, margin usage and the account's floating P/L path were not supplied. The chart therefore cannot show the largest loss experienced while positions remained open. No equity-drawdown percentage or percentage account return is claimed.
Three fixed lot sizes, one historical trade list
0.1 lot per trade: USD 12,740.00 cumulative price P/L; USD 392.90 maximum closed-P/L retreat.
0.5 lot per trade: USD 63,700.00 cumulative price P/L; USD 1,964.50 maximum closed-P/L retreat.
1.0 lot per trade: USD 127,400.00 cumulative price P/L; USD 3,929.00 maximum closed-P/L retreat. [S001]
The larger figures follow directly from multiplication. Raising the fixed size from 0.1 to 0.5 lot multiplies every modeled result by five; moving to 1.0 lot multiplies it by ten. Both negative trades and closed-result drawdowns scale with the gains. The model does not test whether a particular account could fund every overlapping position.
Why the profit factor stays the same
Because all modeled trades are scaled by the same positive factor, the positive-result total and negative-result total change in the same proportion. Their ratio remains 5.67. The price-based positive-trade rate also stays at 77.46%. These unchanged ratios do not mean that the cash risk is unchanged. [S001]
For context on capital and position sizing, see how account size affects trading risk. The scenarios here illustrate sensitivity to volume; they are not recommendations to trade those sizes on any particular deposit.
How this gold trading performance review is calculated
For a buy, the signed move is closing price minus opening price. For a sell, it is opening price minus closing price. Each signed move is then multiplied by the chosen fixed lot size and the explicit 100-ounce model contract. Amounts are calculated before display rounding. [S001]
No extra commission, swap, spread adjustment or slippage estimate is deducted. Historical execution prices may already reflect Bid/Ask execution, so "no separate cost model" must not be read as "live trading has no costs." The calculation isolates the supplied entry-to-exit movements under a constant-volume assumption.
The 100-ounce value is a stated comparison assumption, not a verified specification for the source account. Before applying any money-per-lot calculation to a live account, check that broker's instrument specification. MetaTrader's contract specification documentation explains where relevant symbol details are displayed. [S003]
A dated record that can grow with new trades
The next gold trading performance update will add newly supplied positions to the cumulative record and check repeated transactions before recalculating the totals. Re-uploading the same history should not double the trade count. A changed version of an existing trade needs reconciliation before it replaces an earlier value.
Each published snapshot should identify its latest recorded close, its trade count and its calculation basis. That allows readers to distinguish an updated total from a weekly subtotal. Weekly articles will carry their own dates, and any accompanying videos should use the same verified cutoff and figures.
For information about the service, visit the IQQTrading copy trading service. If you are comparing source and copied results, our guide to copy trading slippage explains why execution differences deserve a separate review.
For related copier and integration requirements, Tramaxis trading software development is a relevant technical resource. Confirm the features of any actual setup with its supplier; software availability does not establish a performance outcome.
Evidence and scope
[S001] Private user-supplied XAUUSD trade records, checked and deduplicated locally on 20 October 2026. All numerical results and original graphics in this review derive from those records and the stated fixed-lot model. No tickets, account identifiers or original exports are published.
[S002] MetaTrader 4 account history documentation explains the distinction between closed results, floating P/L and account information. It does not verify these private trading records.
[S003] MetaTrader 4 Contract Specification, linked in the calculation section. Official documentation accessed on 20 October 2026.
Historical illustrations are not guaranteed future results. Leveraged gold trading can cause substantial losses. This review is educational information and does not provide personalized investment advice.